Reading absorption: when a big order quietly stops a move
Absorption is one of the clearest order-flow signals there is. Here's what it looks like on the tape and the footprint, and how traders use it.
Marco De Vries · Order Flow · · 2 min read
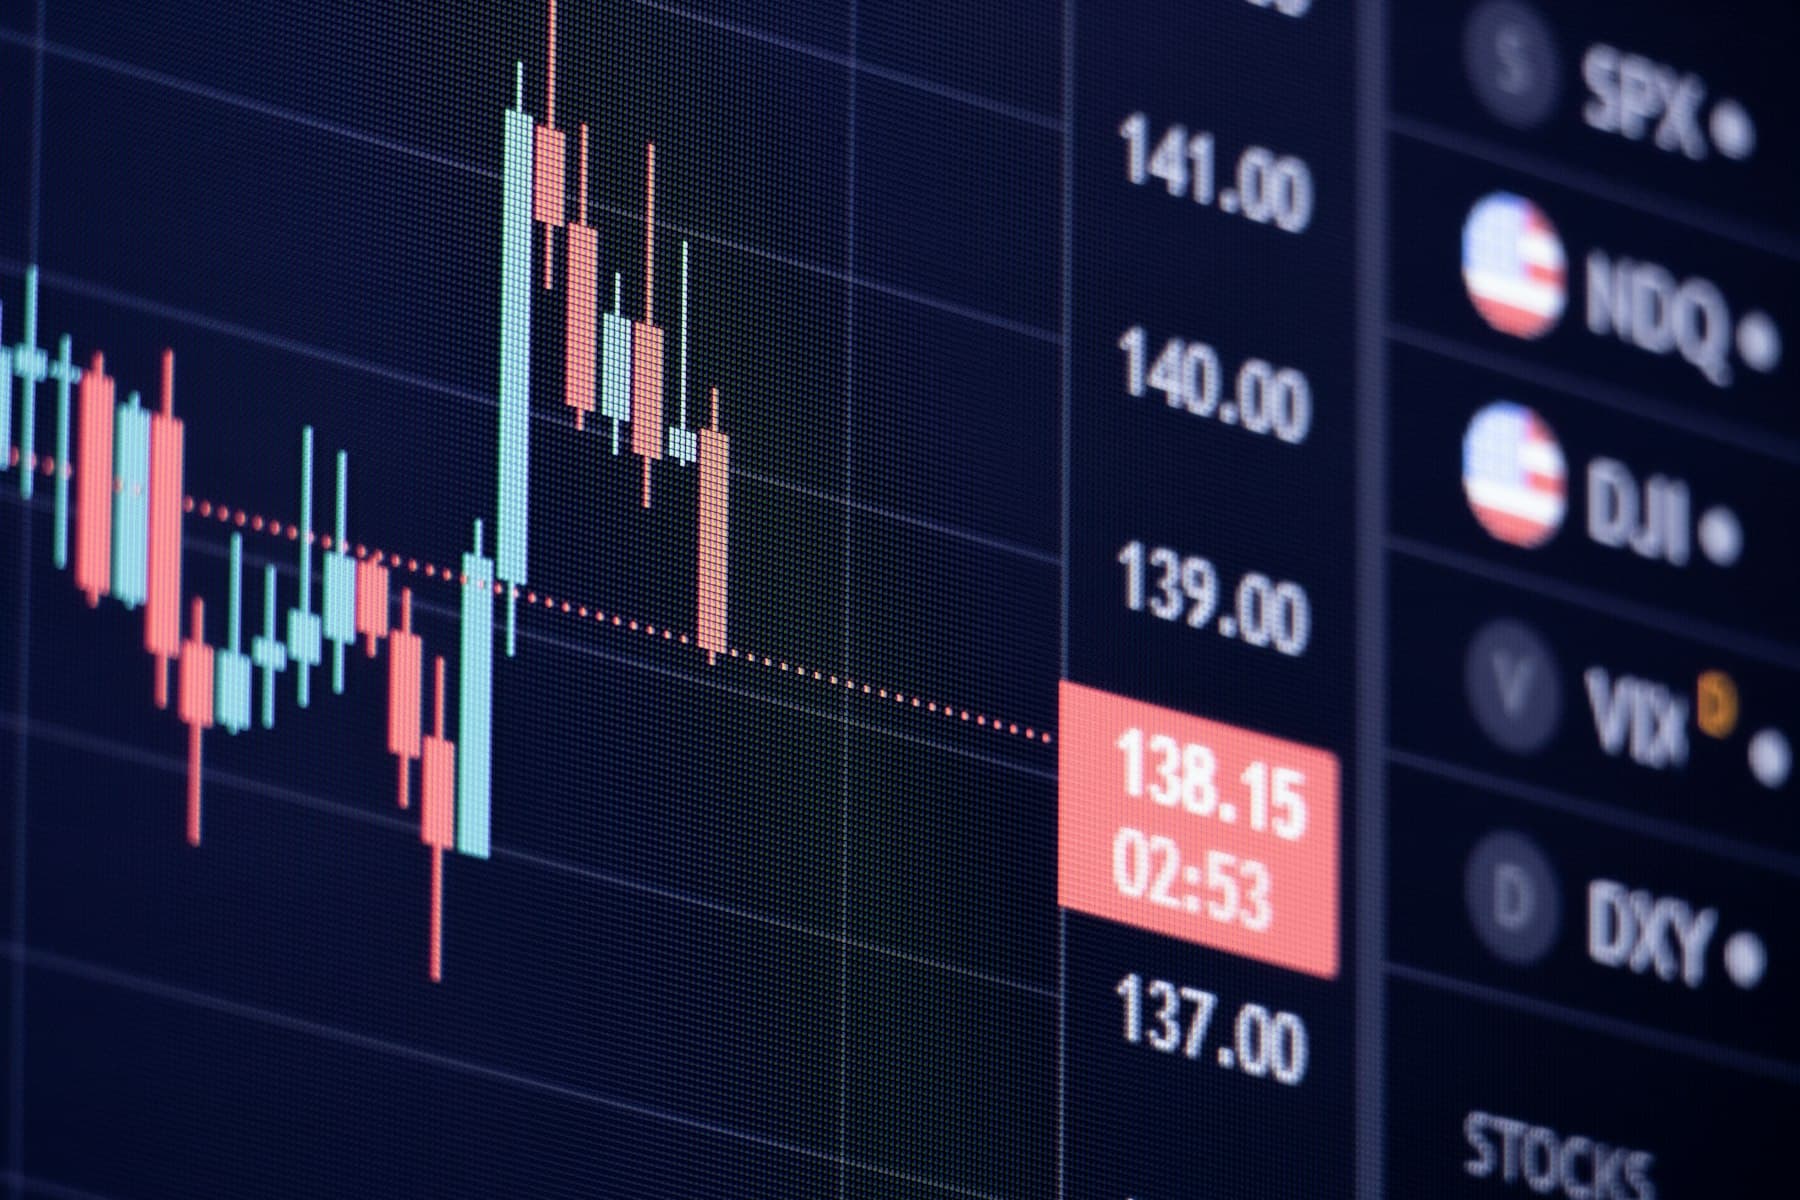
Price is falling into a level. Sellers are hitting the bid, the tape is fast, and then — nothing. Price stops. The selling is still coming, but price won't go lower. That's absorption: a large passive buyer sitting on the bid, soaking up everything thrown at it.
It's one of the most reliable tells in order flow, because it shows intent that a candlestick chart can't. On the chart you just see a wick; on the order flow you see why the wick formed.
What it looks like
- On the DOM: a large bid that keeps refilling as it gets hit, instead of pulling.
- On the tape: heavy selling prints, but price barely ticks down.
- On the footprint: high sell volume at a price that fails to make a new low.
Tip: Refill, not just size
A big order that sits and refills as it's hit is real. A big order that vanishes the moment price approaches is probably spoofing. The refill is the signal.
How traders use it
Absorption at a level you already care about is a confirmation, not a standalone trade. If price is falling into higher-timeframe support and you see a bid absorbing the selling, that's the market defending the level in real time. The entry comes on the turn, with a stop just beyond the point where absorption failed.
The key word is confirmation. Order flow works best stacked on top of a level you'd watch anyway — which is exactly why the Order Flow course assumes you already read structure well.